kg CO2e
Per serving
The stats are stark. One-third of global greenhouse gas emissions come from food-systems, with the footprint from animal products alone making up well over 50% of the industry’s global carbon emissions. It’s really quite simple: choose food that produces less carbon emissions as a step in the right direction to prevent climate change.
Livestock
The livestock sector generates around 16.5% of global greenhouse gas emissions.[1]
Animal products
Well over half of all food-related emissions come directly from animal products.[2]
Land use
Global livestock agriculture uses 77% of agricultural land.[3]
The United Nations Framework Convention on Climate Change (UNFCCC) and The European Commission use a formula called a ‘carbon dioxide equivalent’ (CO2e) to measure a product’s footprint. Here are the CO2e emissions per kg of some UK protein sources.
CO2e per kg[4]
CO2e per kg[4]
CO2e per kg[4]
CO2e per kg[4]
CO2e per kg[4]
Values shown represent farm to factory gate carbon footprints.
Data sources: 1. Twine(2021), 2. Xu et al. (2021), 3. Our World in Data (2019), 4. Quorn Footprint Comparison Report (the Carbon Trust, 2023)
At Quorn®, we’re proud to say we are the first global meat-free brand to have the carbon footprint of our products third-party accredited. Our in-house carbon foot-printing experts do the maths and calculate the emissions of our products. The data is then checked and accredited by the Carbon Trust, so you can be clear on the numbers, when you are choosing what to eat. Where you see one of our products has been certified by the Carbon Trust, it means we’ve not only measured the footprint of the product, but that we’ve also committed to continue to reduce its carbon footprint. So over time, as you enjoy Quorn meals, they will help you reduce your carbon footprint.
CO2e = carbon dioxide equivalent
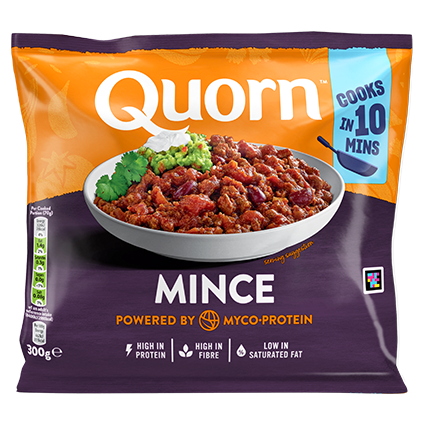
Our products are all measured per kilogram and per serving from farm to fork, showing the carbon footprint of the whole product’s lifecycle


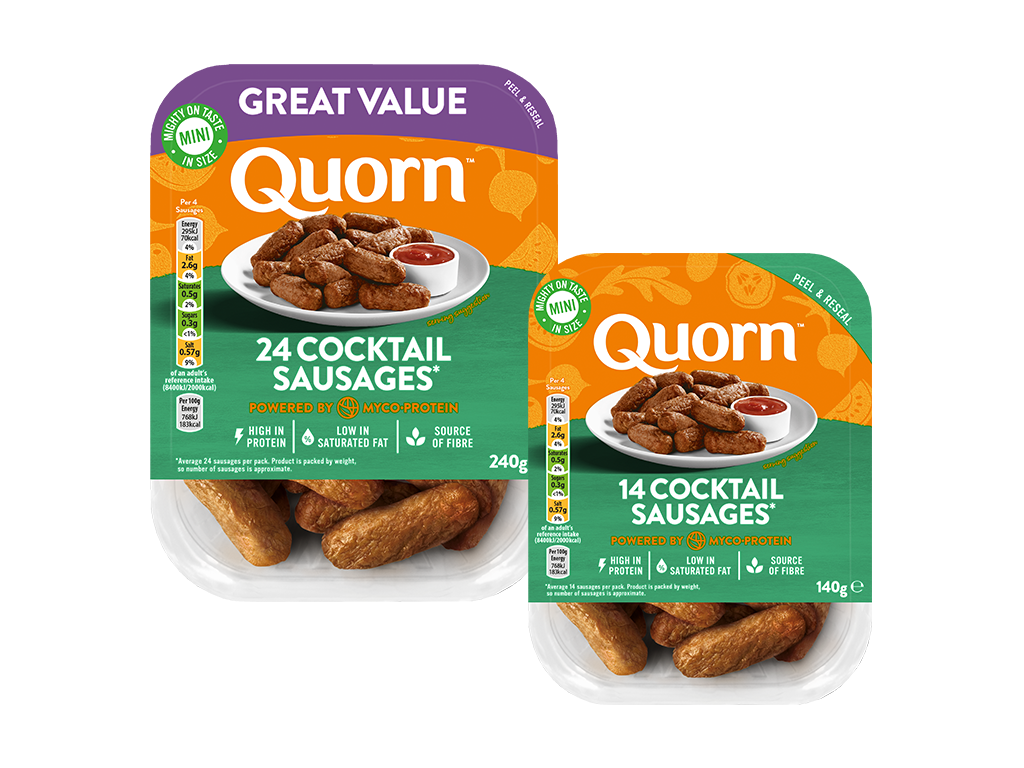
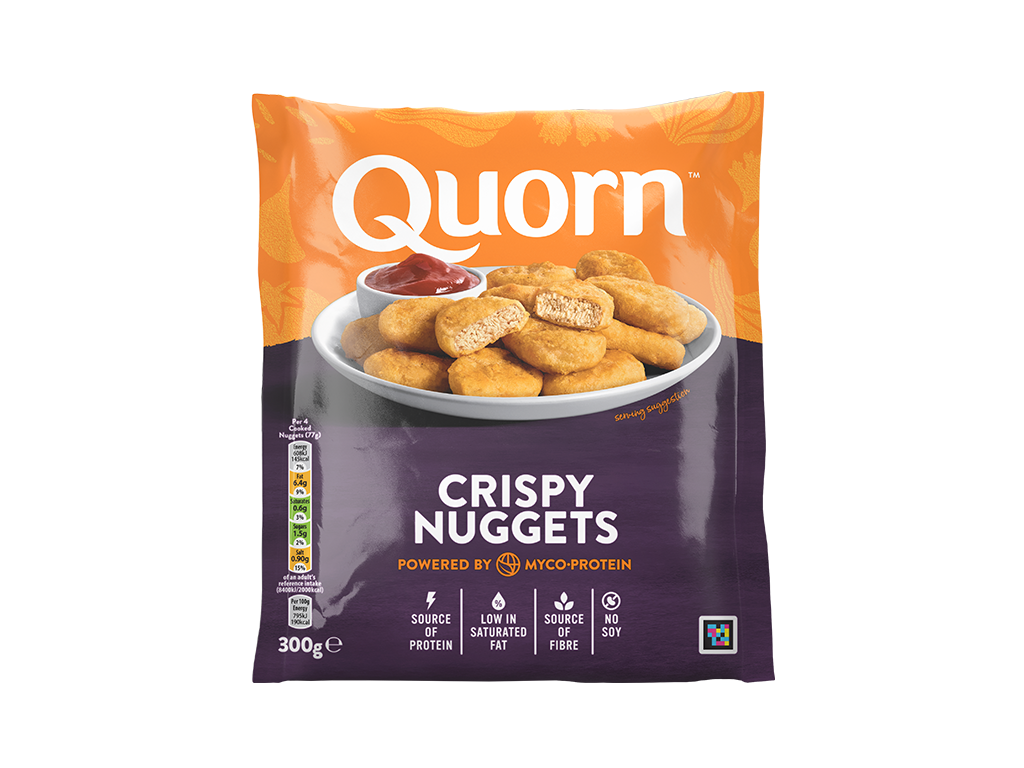
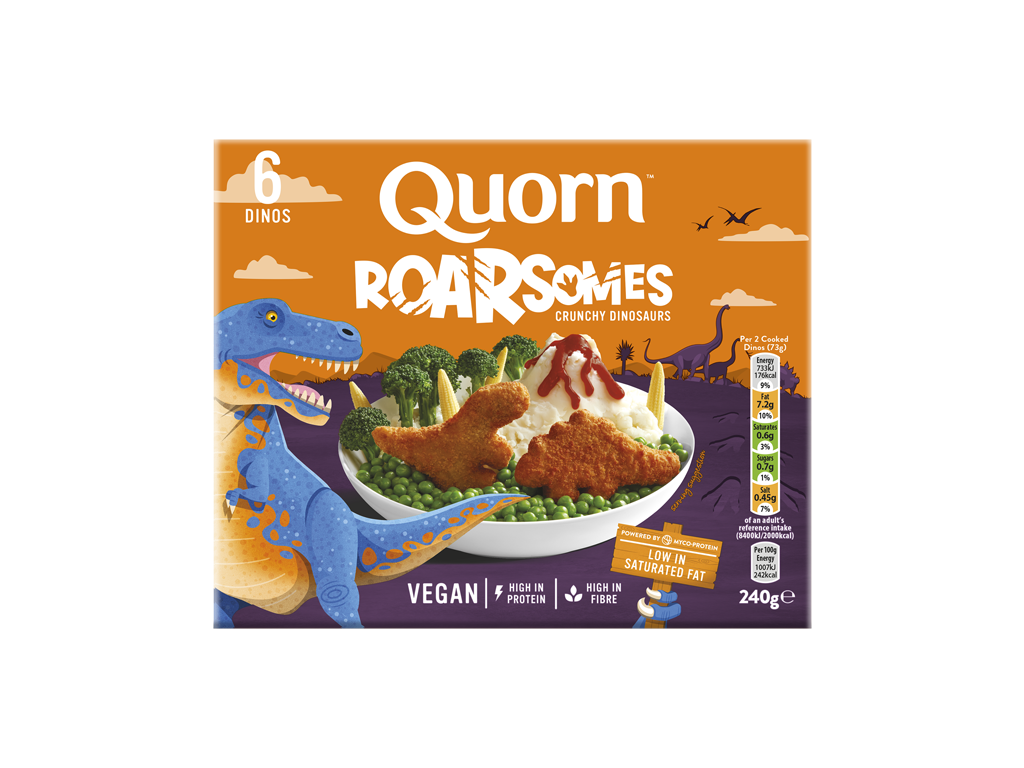
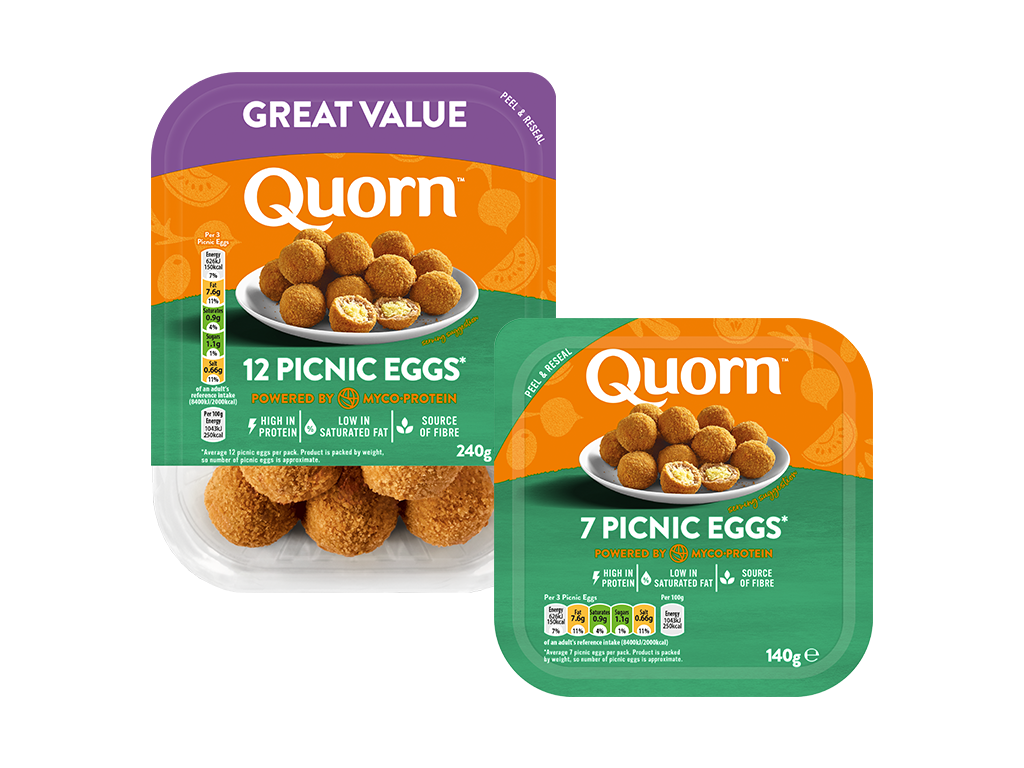
242 cals
(Per 100g)
10g of fat
(Per serving)
Frozen
For full details of our carbon emissions by product, view the full report here.
The Quorn Foods sustainability team works closely with the Carbon Trust to examine the entire lifecycle of our products. From the ingredients we use, to the energy in our factories, transportation and even the packaging you take home with you – right through to emissions related to home storage and cooking, it’s all factored in. We do this to show you our own numbers, and we encourage you to ask other food producers to do the same.
Emissions related to the ingredients we use to make Quorn products.
Emissions related to the places where our products are made, the power we use, the processes we employ, and the waste we produce.
Emissions related to the manufacture, transportation and end-of-life treatment of packaging materials.
Whilst a small contributor to overall emissions, transport is an important measurement to avoid inefficiencies in our supply chains.
At Quorn, our goal is to be transparent and clear about our carbon footprint. You’ll find the answers to our most commonly-asked questions below, but if you want to know more, just get in touch!
See all FAQsFind out more about our carbon footprint reduction efforts.
Our sustainability team works with colleagues across our supply chain, suppliers and co-manufacturers to calculate carbon emissions released at each stage of a product's lifecycle. We then go the extra mile and have partnered with the Carbon Trust since 2012 to analyse and verify our work on product carbon foot printing. The Carbon Trust is an independent, expert third-party partner of leading organisations around the world, helping them contribute to and benefit from a more sustainable future. You can learn more about the Carbon Trust and their work on their official site.
A product carbon footprint is a way of measuring, managing and communicating the greenhouse gas emissions related to goods and services. For Quorn products we take a 'farm to fork' approach - this would include ingredients, manufacturing, packaging, transport, retail, consumer use and end-of-life treatment. Our first product carbon footprints - for our best-selling frozen products Quorn Mince and Pieces - were completed in 2012 and verified by the Carbon Trust. Read more about carbon footprints.
Carbon Trust is an independent third-party expert partner consisting of leading organizations worldwide. With our collaboration, we can contribute to a more sustainable future that everyone benefits from. Since 2012, we have collaborated with the Carbon Trust to analyze and verify our work to calculate carbon footprints for our products. You can learn more about the Carbon Trust and their work on their official site.
We have already made calculations for 60% of our products per sales volume, but we will not stay there. We will add more products to the carbon footprint list.
